
Numbers that know how much they know.
A pipeline that will not let a deal skip the terms, and desk figures that show their denominator and refuse to rank on too little.
No deal is agreed without the terms.
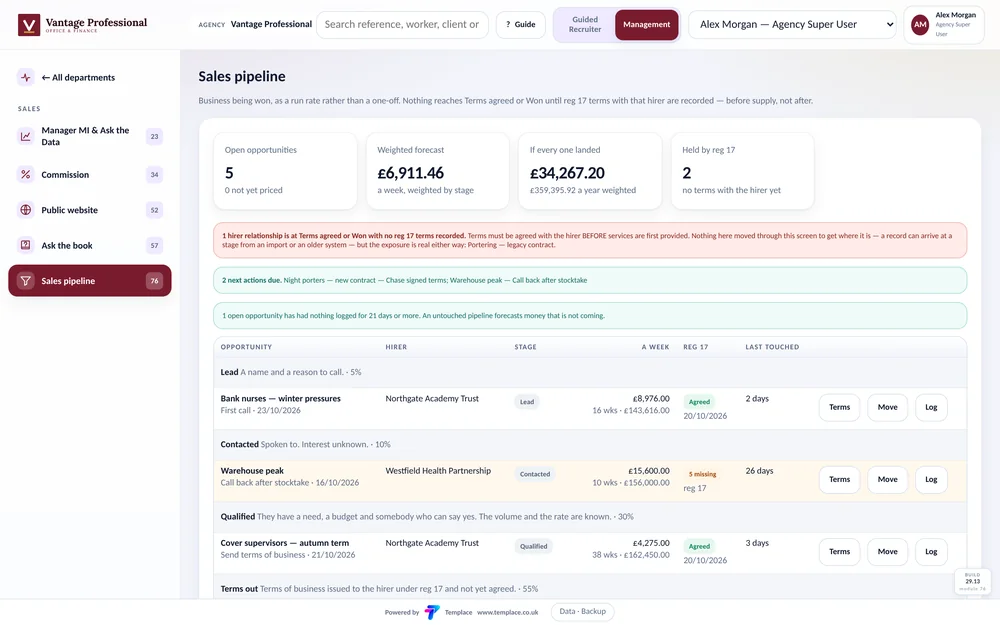
Opportunities move through stages and are valued at their weekly run rate. Moving one to agreed or won needs regulation 17 terms on file as a document, and a hirer on credit hold cannot be won at all.
- Weighted forecast by stage
- Exposed deals listed: agreed without terms
- Every move logged with who and why
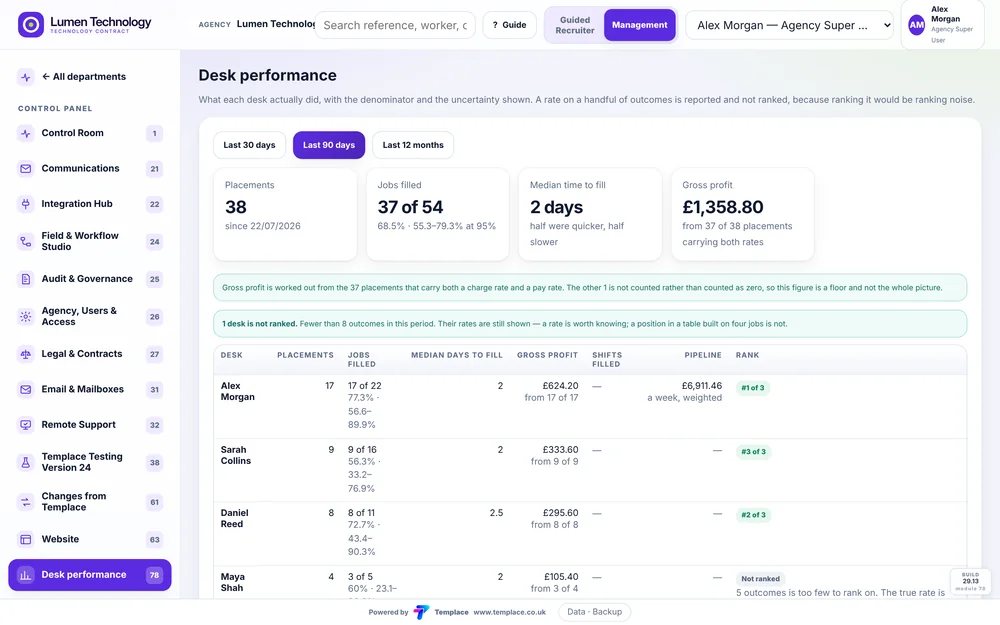
A fill rate with its error bar attached.
Three of five is sixty per cent, and so is thirty of fifty. Every rate shows its denominator and a 95% Wilson interval; below eight outcomes the rank is withheld and the screen says why. Time to fill is a median.
- Placements, fill rate, time to fill and gross profit
- Shifts filled against shifts broadcast
- No activity league tables — they reward the wrong thing
Every figure opens onto the records behind it.
Placements, margin and compliance by branch, sector and desk. Click a number and you get the list it counted.
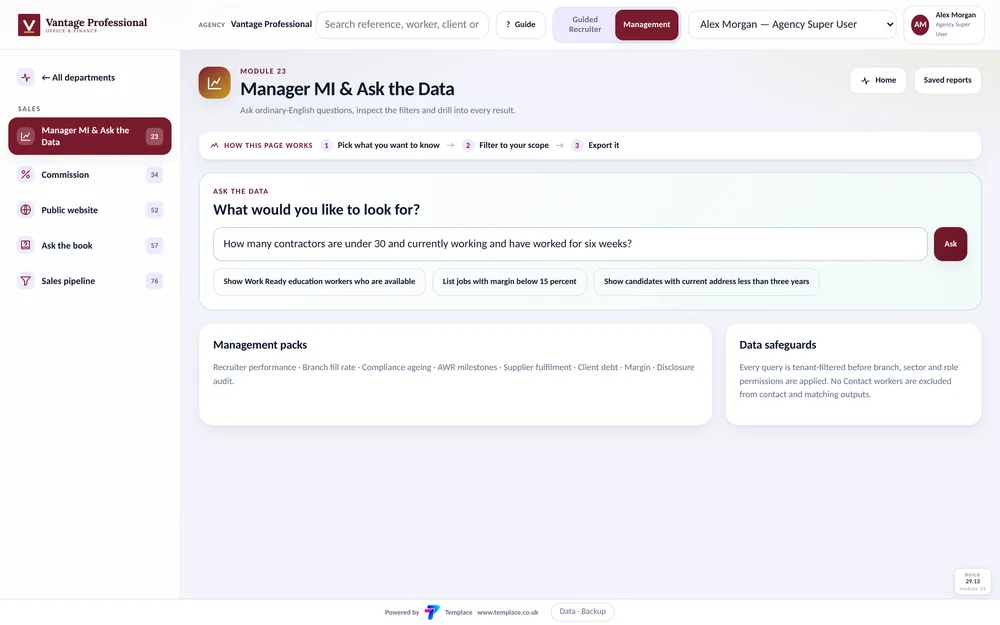
Ask a question in plain English.
“How many workers are released?” The answer comes from the records, with the records it counted.

See it with your own agency’s name on it.
A trial runs on sample data in your colours and your logo, so the people who will use it can judge it as theirs. Tell us your sector and how many workers you place in a week.